Drew Mayer

Product Designer · Atlanta

I Make Complex Products Simple to Use

10+ years designing information architecture, flows and interfaces for Nasdaq, UPS and The Weather Channel. A journalist by training, so I start with what people need to understand, then design the path to it.

See Selected Work Download Resume

40% → 92%

Forrester UX score, UPS.com redesign across 220+ sites

60%

of Nasdaq.com's new sitemap designed and built by me

110 → 8

pages after consolidating The UPS Store site

Webby

2024 Honoree, Best User Experience

Selected Work

Five case studies · process, decisions and results
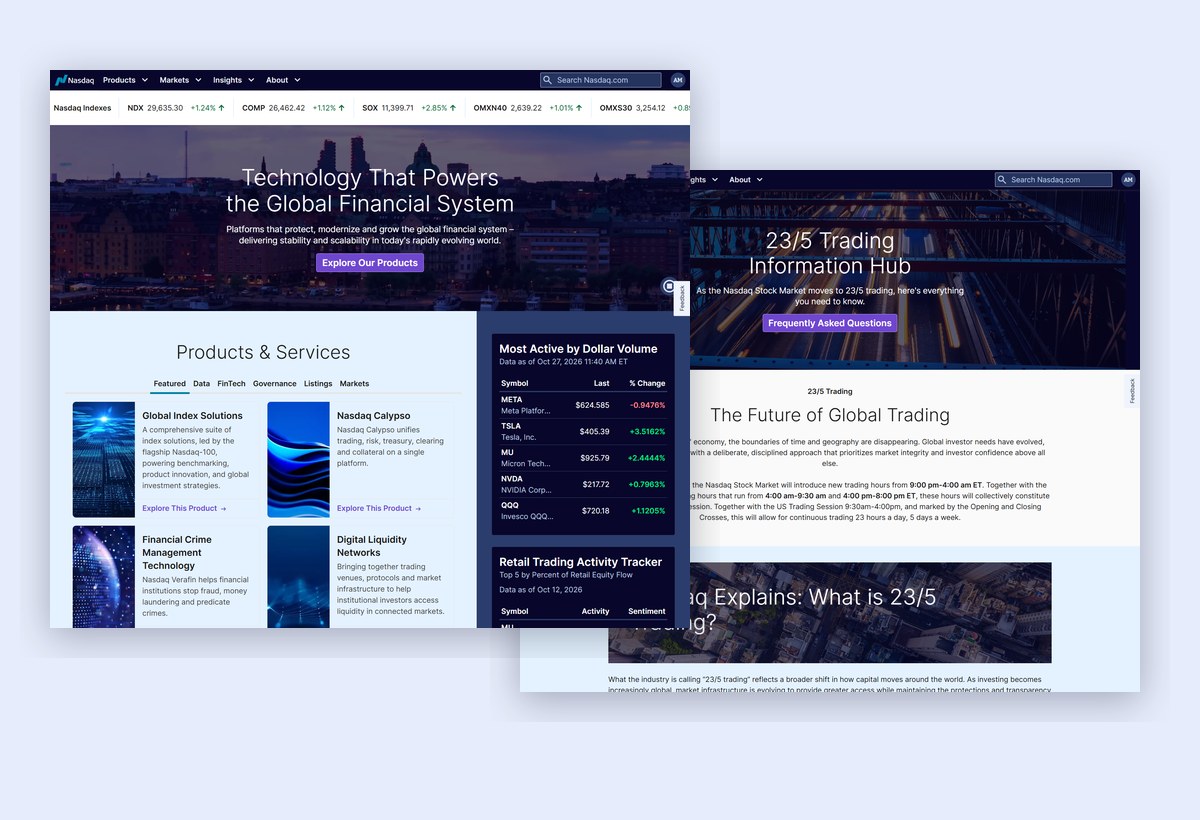
Redesigned Nasdaq.com homepage and 23/5 Trading hub

Nasdaq · 2025–2026 · Featured

Rebuilding How Investors Navigate Nasdaq.com

Information architecture, navigation and content-first prototypes for a full site redesign that launched in Q3 2026.

Information architecture Prototyping CMS design

Read Case Study →

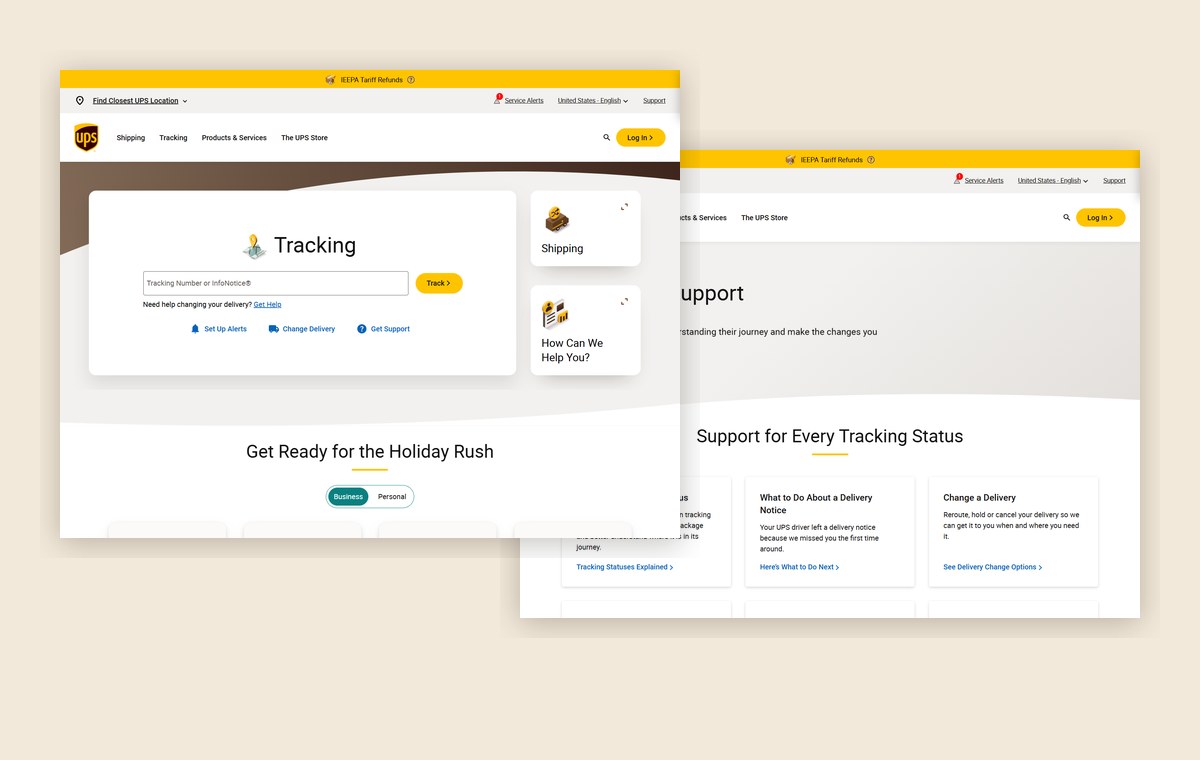
Redesigned UPS.com homepage and tracking support page

UPS · 2019–2024

Simplifying UPS.com for Customers in 220+ Markets

300,000 pages cut by 98%, a new component system, and a Forrester UX score from 40% to 92%.

Read Case Study →

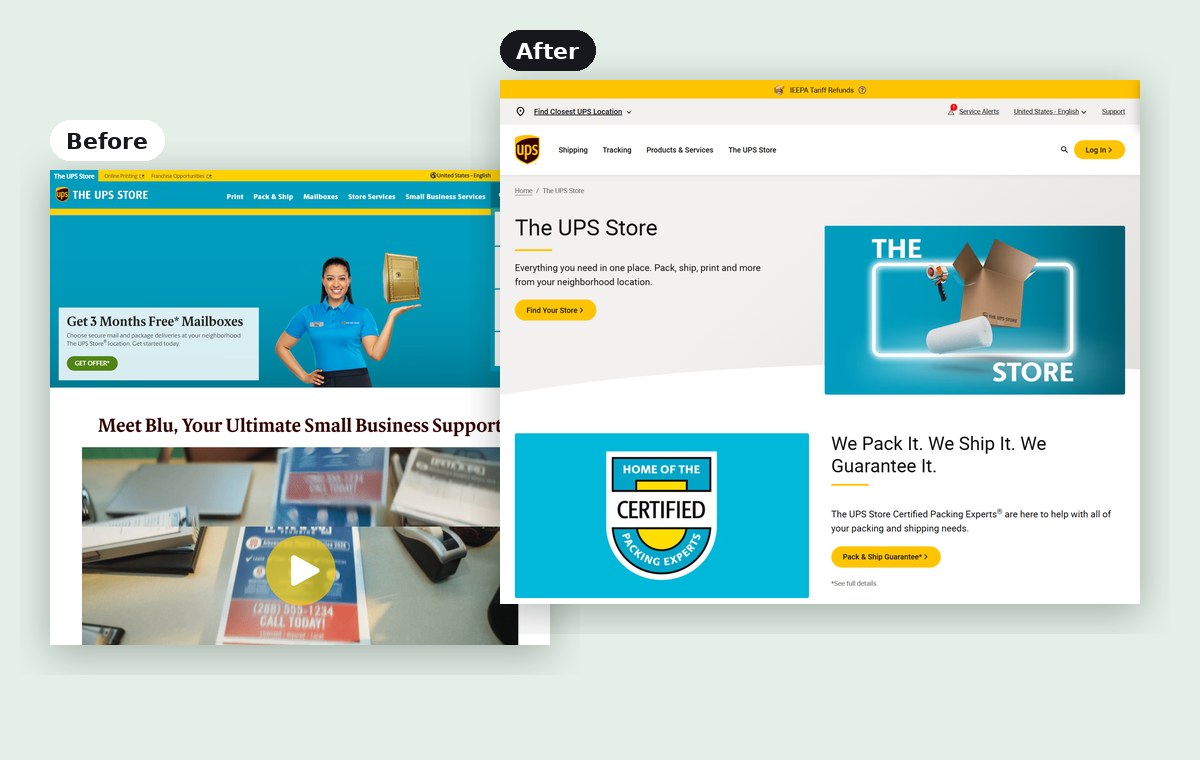
Before: the old standalone The UPS Store site. After: the new microsite inside UPS.com

The UPS Store

One Brand, One Experience: 110 Pages to 8

Folding a standalone franchise site into a UPS.com microsite with one look and feel, and cutting maintenance by 75%.

Read Case Study →

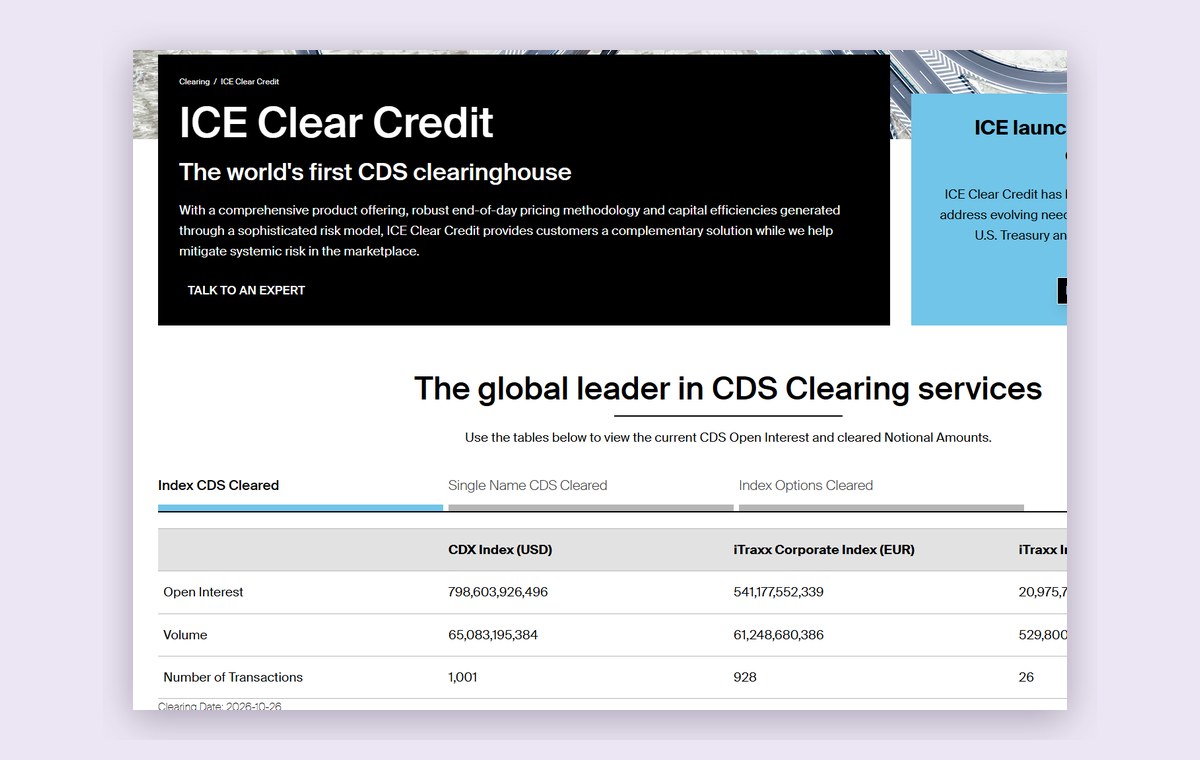
ICE Clear Credit page with the daily CDS clearing data table

ICE · 2024–2025

Building Trust Into High-Stakes Market Data

Rebuilding ICE Clear Credit’s daily CDS clearing tables to update straight from the database, replacing a manual daily process where one wrong number could mislead the market.

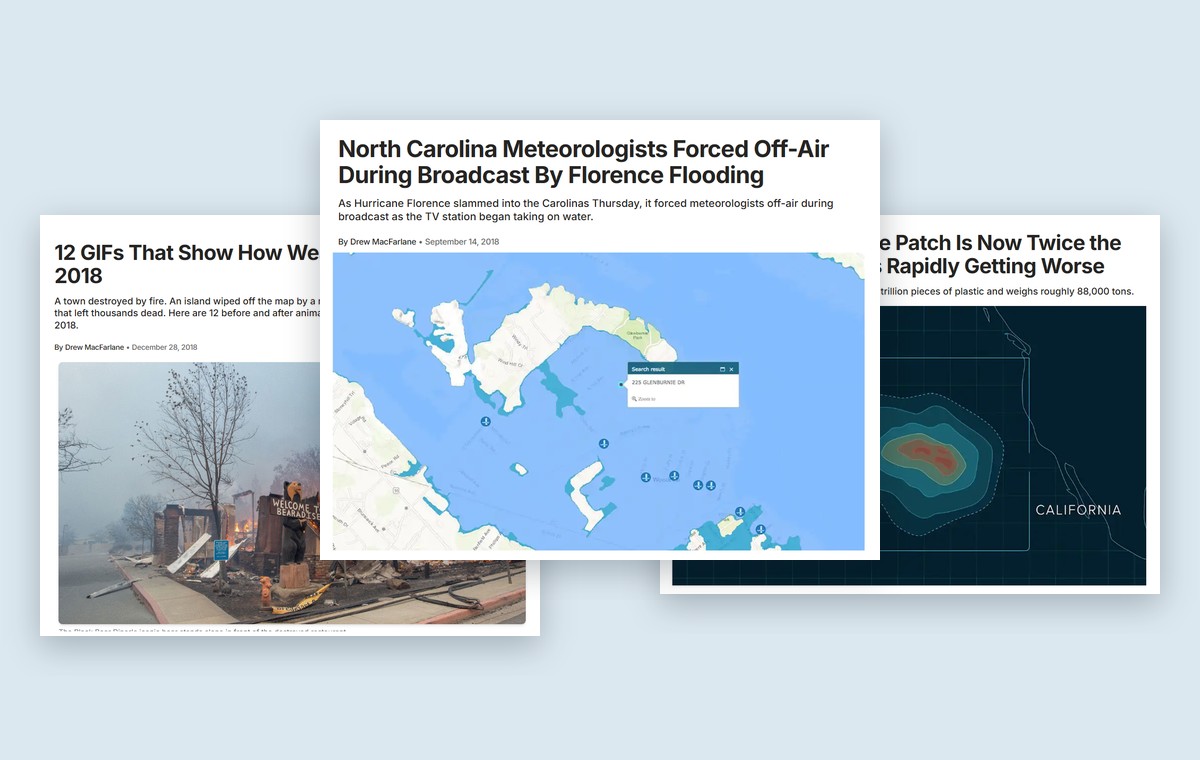
Three weather.com stories by Drew MacFarlane: Hurricane Florence flooding, 2018 weather before-and-after GIFs, and the Great Pacific Garbage Patch

The Weather Channel · 2015–2019

Covering the Human Impact of Extreme Weather

Reported on hurricanes, floods, wildfires and climate change for weather.com, from Hurricane Florence’s storm surge in New Bern to the Camp Fire that destroyed Paradise. Our coverage won Edward R. Murrow and New York Press Club awards.

Read the Featured Story ↓

Featured story · The Weather Channel

Never the Same Every Year
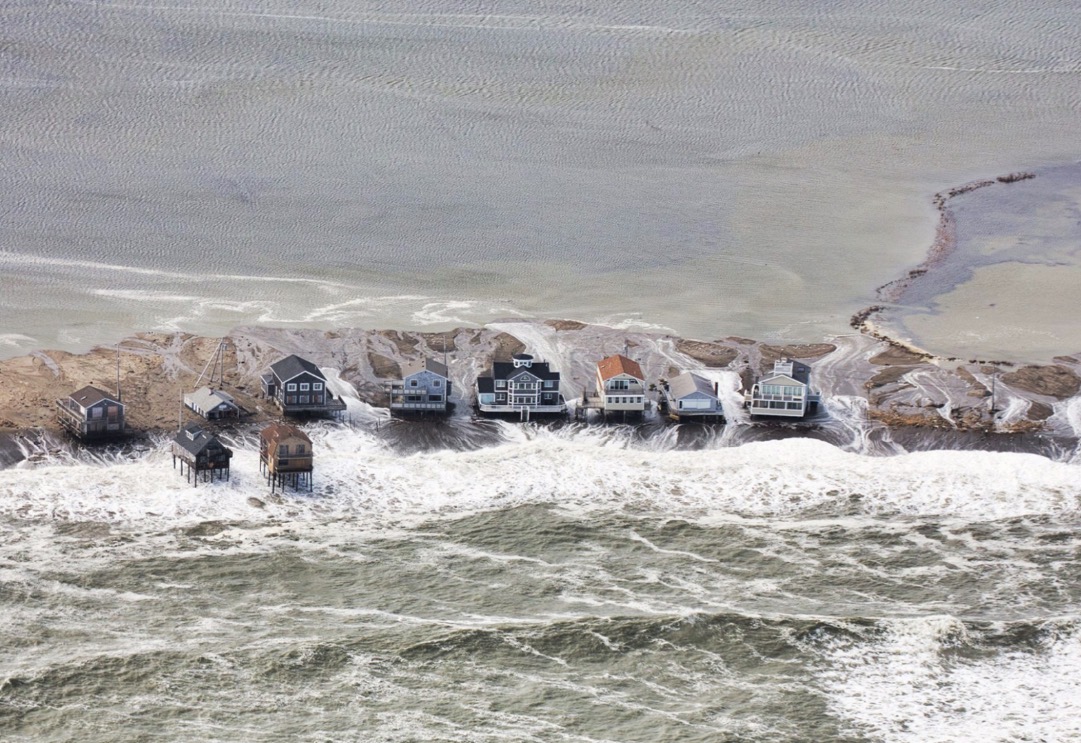
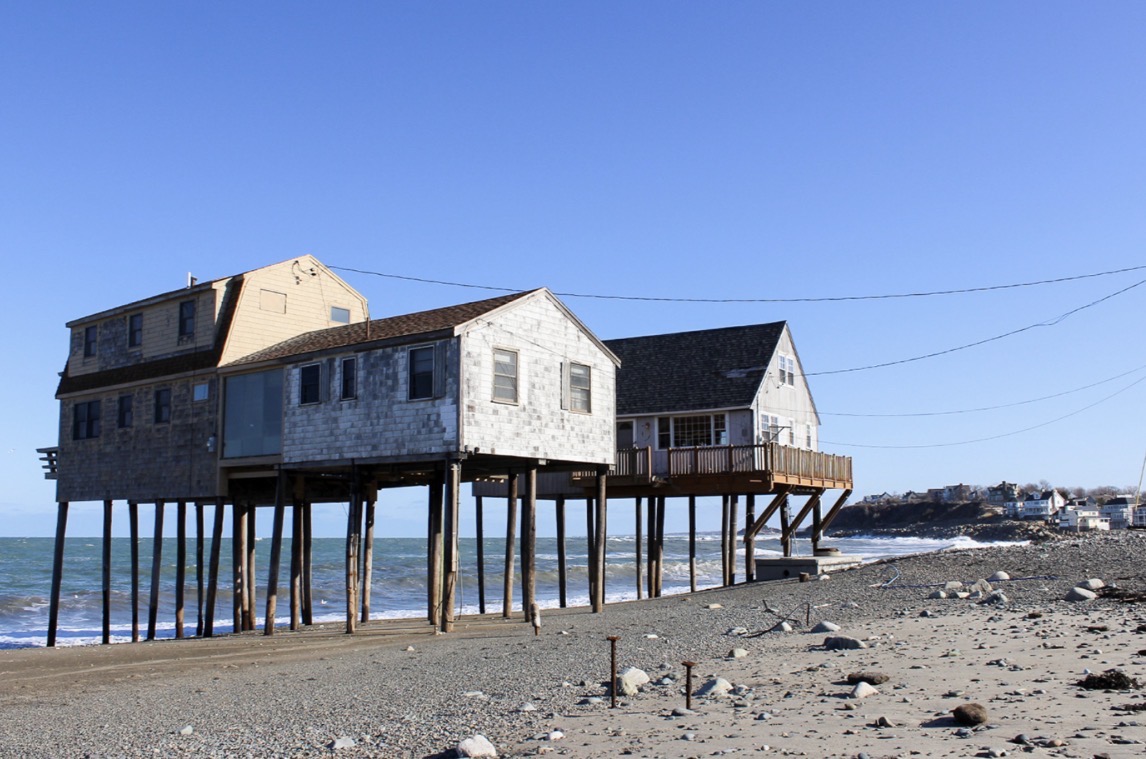
Aerial view of coastal flooding around a row of beach houses in Scituate, Massachusetts, March 4, 2018. Photo: Karl Swenson/SKYWARN Spotter
Inner Harbor Road sign and a Not a Thru sign half buried in sand Beach houses raised on stilts with the ocean running underneath

Featured story · The Weather Channel

Never the Same Every Year
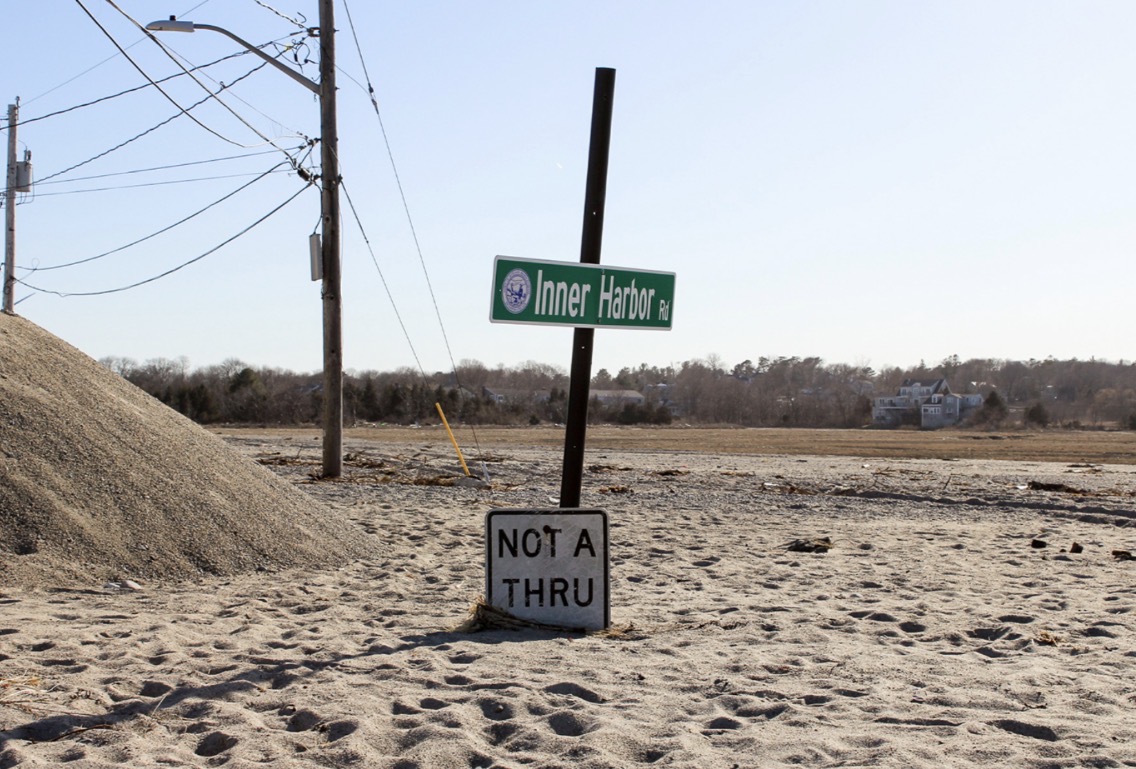
A deep dive into Scituate, Massachusetts, a town battered by nor'easters, and how rising seas and stronger storms are changing life for longtime residents.

“Every year we pull up the stairs and give it a kiss and say ‘I hope you’re here in the spring.’”

Sarah Moran, whose family has owned a Peggotty Beach home since 1922

Before I designed for people in a storm, I reported on them. This story is where I learned to make complex climate data feel personal.

Article: Drew Mayer (MacFarlane) · Video: Drew Mayer (MacFarlane), Kevin Hayes and Will Jauregui
Photos: Andrew MacFarlane/weather.com · Aerial: Karl Swenson/SKYWARN Spotter

Read the Full Story

Passion project · iPhone, Apple Watch & web

Line Change: Turning Heart Rate Into Hockey Stats

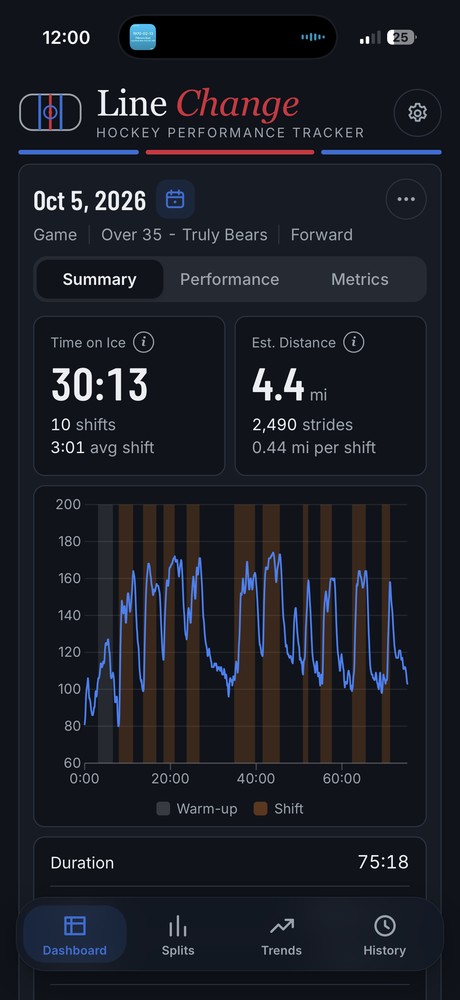
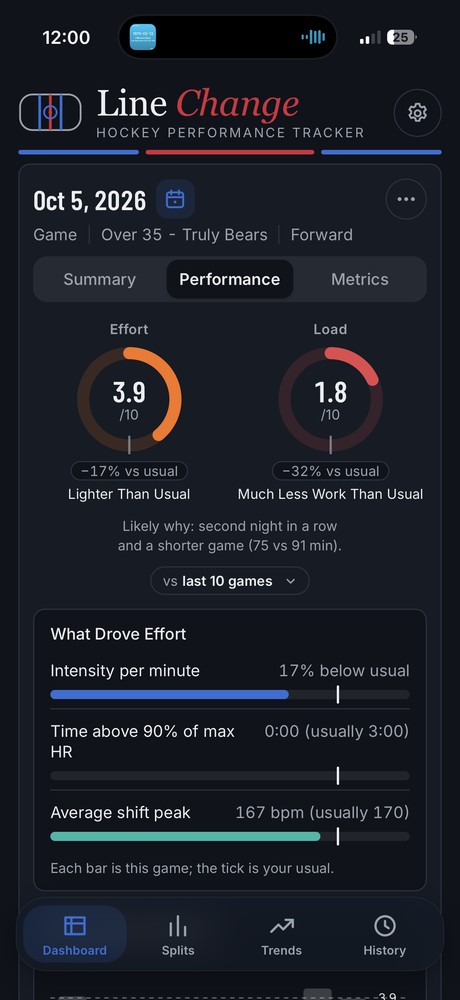
I play hockey and wanted to track my stats like the pros, so I designed and built my own performance tracker. Line Change reads heart rate from a chest strap or watch and infers shifts, time on ice, effort and training load, with no GPS or motion data.
Try the App Read the Case Study
Game summary with time on ice, estimated distance and a heart-rate chart with shifts shaded
Game summary. Shifts detected from heart rate alone.
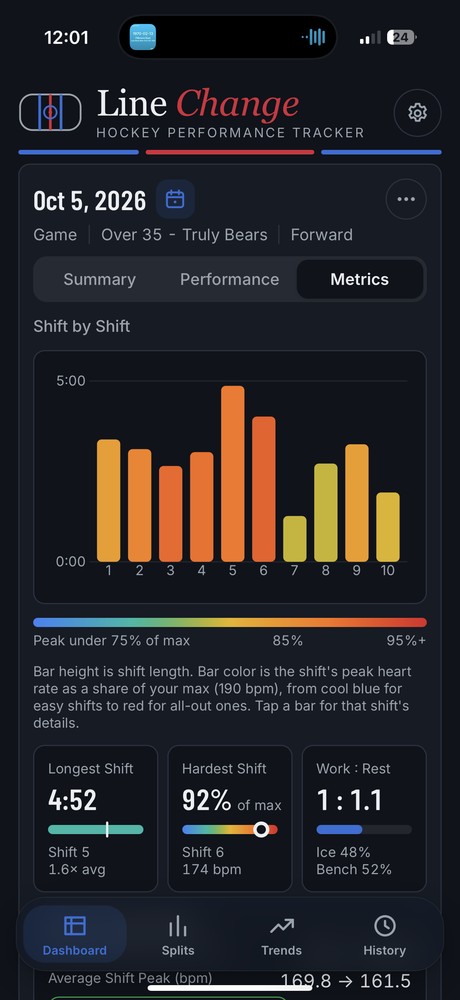
Effort and load scores compared with the player's usual, with a likely-why explanation
Effort vs. your usual. Every score explains its likely why.
Shift-by-shift chart where bar height is shift length and color is peak heart rate
Shift by shift. Height is length, color is intensity.
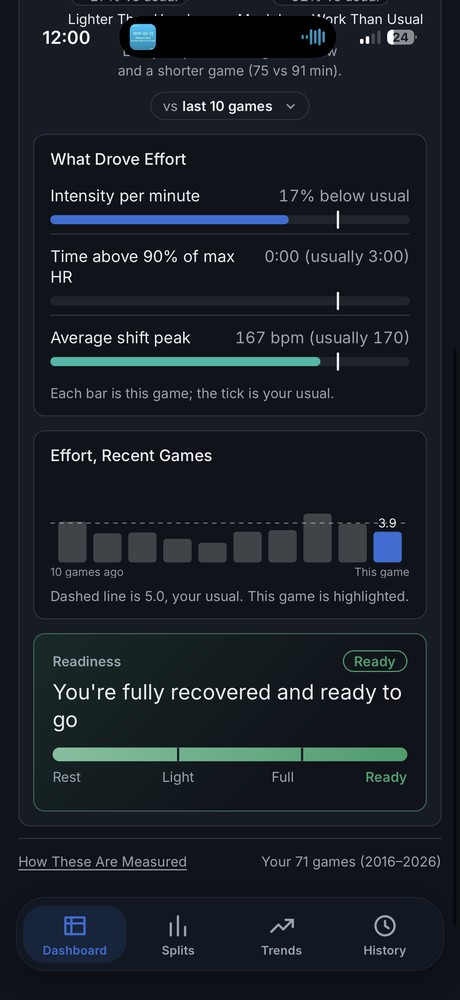
Effort over the last ten games with this game highlighted, and a readiness meter reading Ready
Readiness. Framed kindly: a light night, not a bad one.
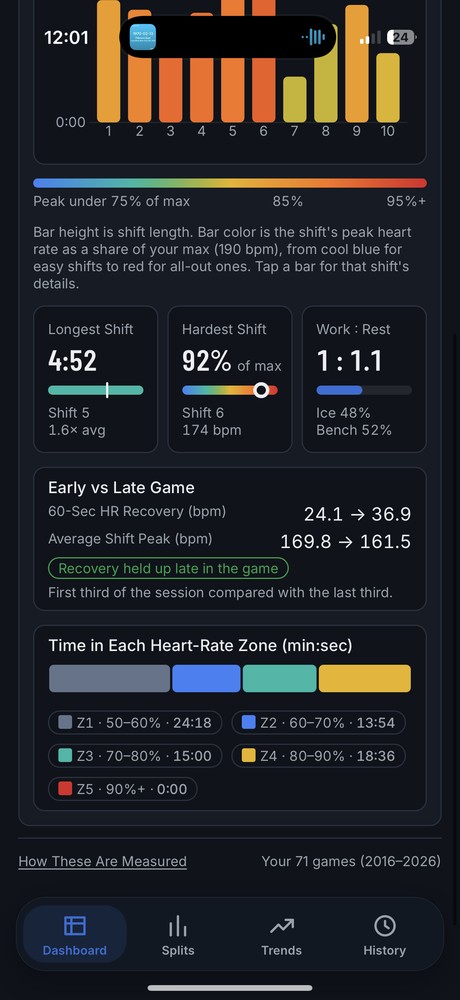
Early versus late game recovery and time in each heart-rate zone
Early vs. late. Did recovery hold up in the third period?

Scroll sideways for more screens →

How I Work

01

Find the Real Task

Analytics, interviews and audits to learn what people come to do.

02

Structure It

Sitemaps, flows and navigation that match how users think.

03

Prototype With Real Words

Interaction and copy designed together, so reviews test the actual experience.

04

Build to Last

Components, patterns and CMS models that keep it consistent at scale.
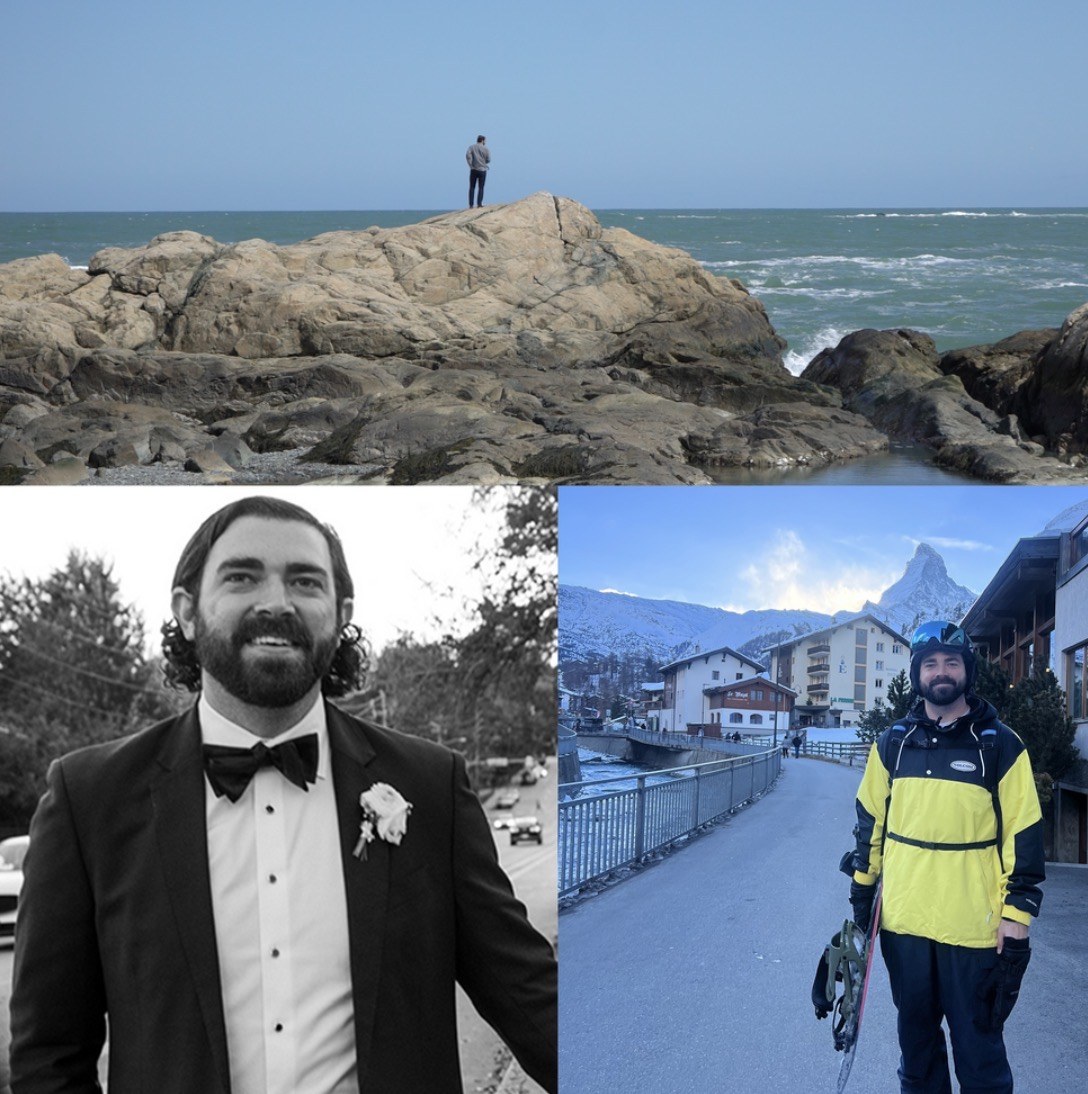
Drew on a rocky coastline, in a tuxedo, and snowboarding in front of the Matterhorn

About

I started in newsrooms, covering hurricanes and nor'easters for The Weather Channel. That taught me to explain complicated things to people under pressure, which is still the core of my design work.

Since then I've led UX for the UPS.com redesign, restructured futures data at ICE and rebuilt Nasdaq.com's information architecture.

Off the clock: ice hockey, ski trips with my wife, live music and distance cycling.

Recognition

Webby Award Honoree

2024 · Best User Experience, UPS.com

Edward R. Murrow Award

2017 · Best Network TV News Website

EPPY Award

2019 · Best News Feature

New York Press Club

2017 · Best Website, Hurricane Coverage